30/08/26 23:20
Another full-on day of tinkering with this site... one day I'll blog about something else. Hopefully...
Anyway, after setting up an AI tarpit yesterday, and some basic monitoring, I spent most of today trying to do monitoring properly. This involved fixing my Caddy logging and feeding it into Alloy and Loki, enabling metrics to consume with Prometheus, and viewing it all in Grafana.
First step: Fix my awful Caddy logging. Like the n00b I am, I'd set up seperate logs for each site block, and was using log_skip to try and filter out noise. Check the last post for the bad config. That is not a great way to do it. Instead, just log everything globally like so:
{
	metrics {
		per_host
	}

	log access {
		output file /var/log/caddy/access.json {
			mode 0644
			roll_at 00:00
			roll_size 1GiB
			roll_keep 14
			roll_keep_for 336h
		}
		format json
	}
}

ryankrage77.me {
# Set this path to your site's directory.
	root * /srv/www/ryankrage77.me

	# Enable the static file server.
	file_server
	try_files {path}.html
	encode zstd gzip

	#LOGS! NO LOGS
	log access
}

#another example
example.example.com {
	reverse_proxy someservice.local:80
	log access
}
Much cleaner, and more maintainable - any future service just need a log access thrown in there, rather than re-creating the entire logging config every time. I also enabled Caddy's built-in metrics, which it serves as json on port 2019 by default.
For collecting and analysing this data, I then built a stack with Docker Compose, consisting of Alloy, Loki, Prometheus, and Grafana. Oh, and I installed Grafana's Node Exporter too, which collects system metrics (CPU usage, etc). That one lives outside of Docker so it can actually access those metrics, it can be installed with your package manager. The full stack looks like this:
First steps:
sudo mkdir -p /opt/monitoring/{prometheus,loki,alloy}
sudo chown -R "$USER":"$USER" /opt/monitoring
cd /opt/monitoring
Then create a compose file:
services:

  prometheus:
    image: prom/prometheus:latest
    restart: unless-stopped
    network_mode: host
    volumes:
      - ./prometheus/prometheus.yml:/etc/prometheus/prometheus.yml:ro
      - prometheus-data:/prometheus

  loki:
    image: grafana/loki:latest
    restart: unless-stopped
    ports:
      - "127.0.0.1:3100:3100"
    command: -config.file=/etc/loki/loki.yml
    volumes:
      - ./loki/loki.yml:/etc/loki/loki.yml:ro
      - loki-data:/loki

  alloy:
    image: grafana/alloy:latest
    restart: unless-stopped
    command:
      - run
      - /etc/alloy/config.alloy
      - --storage.path=/var/lib/alloy/data
    volumes:
      - ./alloy/config.alloy:/etc/alloy/config.alloy:ro
      - /var/log/caddy:/var/log/caddy:ro
      - alloy-data:/var/lib/alloy/data

  grafana:
    image: grafana/grafana:latest
    restart: unless-stopped
    network_mode: host
    volumes:
      - grafana-data:/var/lib/grafana

volumes:
  prometheus-data:
  loki-data:
  alloy-data:
  grafana-data:
Then to create the config files for each service, inside the respective directories:
global:
  scrape_interval: 15s

scrape_configs:
  - job_name: caddy
    static_configs:
      - targets:
          - localhost:2019

  - job_name: node
    static_configs:
      - targets:
          - localhost:9100
auth_enabled: false

server:
  http_listen_port: 3100

common:
  path_prefix: /loki
  replication_factor: 1

  ring:
    kvstore:
      store: inmemory

schema_config:
  configs:
    - from: 2026-08-01
      store: tsdb
      object_store: filesystem
      schema: v13
      index:
        prefix: index_
        period: 24h

storage_config:
  filesystem:
    directory: /loki/chunks

limits_config:
  retention_period: 14d

compactor:
  working_directory: /loki/compactor
  retention_enabled: true
  delete_request_store: filesystem
local.file_match "caddy_logs" {
    path_targets = [
        {
            __path__ = "/var/log/caddy/access.json",
            job      = "caddy",
        },
    ]
}

loki.source.file "caddy" {
    targets    = local.file_match.caddy_logs.targets
    forward_to = [loki.process.caddy.receiver]
}

loki.process "caddy" {

    stage.json {
        expressions = {
            host   = "request.host",
            method = "request.method",
            uri    = "request.uri",
            status = "status",
        }
    }

    stage.labels {
        values = {
            host   = "host",
            method = "method",
            status = "status",
        }
    }

    forward_to = [loki.write.local.receiver]
}

loki.write "local" {
    endpoint {
        url = "http://loki:3100/loki/api/v1/push"
    }
}
I only just noticed while writing this that grafana doesn't need a config - don't worry, I've checked the instructions here reflect that in case you're following along!
I ended up using host networking mode for Prometheus and Grafana - Prometheus so it can get Caddy's metrics, and then it was easier for grafana to live there too to talk to prometheus. It is absolutely possible to do this better/properly, but this was the easiest method for me.
The prometheus config above assumes you're using node exporter. If you need to, now's a good time to run sudo apt install prometheus_node_exporter or your package manager's equivelant, or remove the node config from prometheus.yml.
One important note before running docker compose up -d - Grafana's default credentials are admin:admin. If you're exposing it to the internet, bots could be at the door very quickly. For example, you set up a reverse proxy in Caddy and it gets an https certificate for you - there are various services that publish real-time streams of registered certificates, and those are a good source for malicious actors looking for newly-setup sites to attack.
If port 3000 is open locally, you can start the stack and log into Grafana over localhost before making it accessible outside. Otherwise, set the environment variables in your compose file:
GF_SECURITY_ADMIN_USER: admin
GF_SECURITY_ADMIN_PASSWORD: correct_battery_horse_staple
With that important note out of the way, now you can run docker compose up -d. With any luck, the entire stack should start up, and you're ready to start using Grafana. You can check for errors with docker compose logs [container name].
Then it's just a case of adding Prometheus and Loki in the Grafana web UI. Unless you've done a better job with Docker's networking than me, they'll both be at localhost.
Now how to actually, y'know, monitor anything? This part kind of sucks actually. This setup collects a lot of data, so it can kind of annoying to find what you're after. I'm not gonna cover navigating the Grafana UI - I'll just share the queries I ended up setting up. Things like label names might vary with how your logs are formatted.
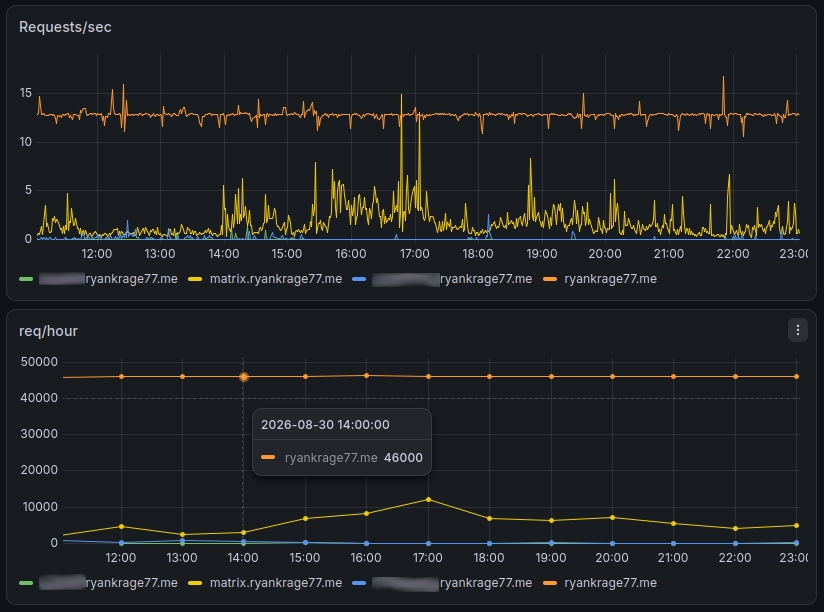
sum by (normalised_host) ( label_replace( label_replace( rate(caddy_http_requests_total{server="srv0"}[1m]), "normalised_host", "$1", "host", "^(.*):443$" ), "normalised_host", "$1", "host", "^([^:]+)$" ) ) - requests/second, with clean host labels (combines domain.com with domain.com:433, for example).sum by (normalised_host) (label_replace(label_replace(increase(caddy_http_requests_total{server="srv0"}[1h]), "normalised_host", "$1", "host", "^(.*):443$" ), "normalised_host", "$1", "host", "^([^:]+)$" )) - same thing for requests/hour.sum by(status) (count_over_time({host="ryankrage77.me"} | logfmt [1m])) - status codes returned/second for a particular domain. Useful for seeing a big spike in errors codes.sum by (normalised_host) (label_replace(label_replace(rate(caddy_http_requests_total{server="srv0", host=~"^matrix\\.ryankrage77\\.me(:443)?$" }[1m]), "normalised_host", "$1", "host", "^(.*):443$" ), "normalised_host", "$1", "host", "^([^:]+)$" ) ) - this one gets requests/sec for a particular domain, with clean labels, in case you want to seperate it out from the other domains into its own graph.I also made a simple query to monitor system load from node exporter - unfortunately I can't share it as text as it's multiple queries, but I just got node_load1, 5 and 15.
As for monitoring logs - I haven't actually had much luck with Loki yet. The 'Drill Down' feature is very useful for finding specific log entries, but due to the high cardinality of the data, things like IP's or URI's can't be turned into labels, so graphing anything is a pain. Graphing raw log volume is trivial, but the metrics in Prometheus is bettter for that anyway.
Instead, I turned back to GoAccess, which I was using previously. Before, I was using log_skip to try and filter down the logs, but now I'm logging everything, I need to filter on the log file itself before passing it to GoAccess. As the logs are json, this can be done with jq. I settled on this setup with a script.
#!/bin/sh

/usr/bin/jq -c 'select(.request.host == "ryankrage77.me" and (.request.uri | test("^/articles(?:/|$)") | not) and (.request.uri | test("^/\\.well-known/matrix") | not))' /var/log/caddy/access.json > /home/ryan/access-filtered.json
/usr/bin/goaccess /home/ryan/access-filtered.json \
  --log-format=CADDY \
  --persist \
  --restore \
  --db-path=/var/lib/goaccess \
  -o statistics.html \
  --ignore-status=404 \
  --ignore-status=308 \
  --ignore-crawlers \
  --exclude-ip=192.168.1.0-192.168.1.255
With a combination of jq paring down the logs, and a few exclusions in GoAccess, this narrows things down to the main site, cuts out the AI tarpit and .well-known/matrix, bots hitting 404/308 looking for vulnerabilities, obvious crawlers, and my local network. That pretty much just leaves 'real' traffic, which is what I'm interested in. There may be a few false positives, but at least I can now view useful data rather than noise from bots and Matrix discovery, which far outpaces actual visitors. Then, the script can be run as cron job, and the output published somewhere on the site to view.
There's still more work to be done, lots more data to pull out of the logs, but for the moment I'm pretty happy with the setup. One thing it has showed me is that I was wrong about bot activity in the tarpit tapering off yesterday. It's actually been going steady at a remarkably consistent ~46000/requests an hour. Sometimes exactly that number.
And my 'clean' logs with GoAccess showed me I have less than 30 visits from real people. But that's still more than I was expecting, so thank you for reading!